Two-Dimensional Max-Diff (2DMD)

This article was published in Quirk’s Magazine, October 2018 issue.
Prioritization and Max-Diff
A common problem in research is prioritization of a list of items (features, messages, etc.). With only a handful of items a ranking exercise works nicely, though it doesn’t really provide information on the spacing between the ranks. A constant sum scale is better, though it cannot be used when there are more than a handful of items. The research industry has gravitated toward widespread use of maximum difference scaling (Max-Diff) as a standard way of handling this task. The Max-Diff approach can easily handle many items, and provides both rank ordering and spacing between the ranks (in the form of individual-level attractiveness scores).
In the standard Max-Diff approach, respondents are presented sets of (generally) 3-5 items and asked to choose the most and least important items in each set. This information is used to estimate the preference scores at the individual respondent level using Hierarchical Bayesian (HB) analysis. With this information we can array the items on a chart from most to least important. While this is now an industry standard approach, it does have a significant drawback: the items are arrayed on only one dimension (usually, importance). But sometimes in practice, it is important to sort the items on a second dimension (say, uniqueness or innovativeness). In such cases the practice is to conduct another Max-Diff exercise with that framing or to ask rating scaled questions to get at that information. This can be a tedious process for the respondents, especially when more than a handful of items are involved. The information from the two exercises are plotted together in a quadrant chart to provide insights.
A More Efficient Approach to Feature Prioritization
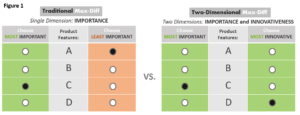
The question then is whether there is a more efficient way to get at the answer – one that does not require the respondent to go through the exercise twice. Well, since a standard Max-Diff task does ask respondents to provide two evaluations per question set (most and least important), why not ask them to evaluate each set of items for the two dimensions instead? Let’s say we are interested in the importance and innovativeness of the items. Then, let each respondent evaluate each set of items and pick two – the most important and the most innovative items in that set (See Figure-1).
Other than that, the data collection process can proceed just as it would in a regular Max-Diff study.
An immediate question that comes up is whether the same item can be allowed to be chosen for both dimensions. The traditional Max-Diff approach does not allow the same item to be chosen as most and least important (which would be nonsensical). However, conceptually there is nothing wrong with an item being considered both important and innovative by consumers. So, there is good reason for us to allow this in the data collection phase, so that it becomes possible to identify items that have both characteristics (as also those that don’t).
Once the data are collected, they can be analyzed to produce two sets of preference scores (one for importance and one for innovativeness) for each respondent. Then, by plotting the responses on a quadrant chart, we should be able to identify winners (important and innovative items) as well as dogs (neither important nor innovative).
Sounds good in theory but will it work in practice?
A Fun Example
To run an initial test, we decided to use a somewhat unconventional topic – movies, evaluated as commercial or artistic. The primary attraction of this topic is that we could evaluate the results for face validity (i.e., whether they made sense), by inspecting where particular movies fell in the quadrant chart.
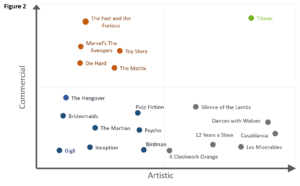
As can be seen in Figure 2, we get a good spread of data points with the bulk of the data spread over three quadrants. One movie stands out as the only one (high up) in the last quadrant. This movie (Titanic) is generally seen as both a commercial and artistic success. And there are many other movies that fall in expected locations. In the commercial quadrant we find movies such as The Fast and the Furious, The Avengers and Die Hard, while the artistic quadrant comprises movies such as Dances with Wolves, Casablanca, Les Misérables and 12 Years a Slave. And, in the lowest position of the lowest quadrant we find Gigli. It does seem somewhat odd that movies like The Martian are not further up, but it could be because of the comparative nature of the Max-Diff approach and Titanic’s overwhelming dominance.
While this was a fun study to run and the results generally seem acceptable, there is no doubt that there can be differences of opinion about the placement of specific movies, and even the nature of the dimensions themselves, i.e., the distinction between commercial and artistic. But the results were methodologically encouraging enough as a test that we moved on to a more conventional marketing research example.
A Research Example
This time the features were for a smartphone (largely taken from an earlier iteration of the iPhone) and respondents evaluated each set of items on importance and innovativeness. The results are shown in Figure 3.
If the two dimensions are highly correlated (basically seen as one), then what we should observe is a narrow array of points stretching along the diagonal. Instead, we see a nice scatter of points across the four dimensions, indicating that respondents do indeed see these dimensions as very different, with a correlation coefficient near zero (-0.06).
In looking more closely at the items, we see some interesting results. While no item stands out (like Titanic), water resistance is seen to be both important and innovative, while dust resistance is seen as important but not innovative. 3D Touch is seen as very innovative but not especially important, whereas quicker data download has the opposite perception. Jet black finish is seen as neither important nor innovative. Knowing these results can allow the marketer to more accurately position the product, as compared to simply using regular Max-Diff results.
Two-Dimensional Max-Diff Is a More Efficient Replacement
Where is the 2DMD approach most likely to be useful? Certainly not as a replacement for regular Max-Diff where a distinction along only one dimension is required (as in the measurement of item importance). But in situations where researchers are forced to conduct two Max-Diff exercises in order to accommodate client demands for information on two dimensions, this is likely to be a more efficient replacement, saving respondents from tedium and reducing the length of the survey (and therefore cost). There is indeed a drop-off in not measuring the “worst” item of the “best/worst” dichotomy, but given the burden of an entire extra exercise on the respondent, it appears to be a reasonable trade-off to make.
Since importance is almost always likely to be a dimension of interest in prioritization exercises, a more general way to look at this approach is to think of it as measuring importance along with one other quality. It can be uniqueness, innovation or any other quality that seems to be minimally correlated with importance but whose intersection with importance has marketing implications. A quick look at the dispersion in the quadrant chart will indicate the distinction between the dimensions and how specific attributes could be appropriately positioned.


